Guide
Job Costing for Concrete Contractors: Yards, Pump Time, and Finishers
Concrete jobs leak money in yards, pump and truck time, and finishing hours. How to track all three against the estimate on every pour, with a pour log.

Concrete is an easy trade to lose money in without noticing. The material is ordered by the yard, the crew is paid by the hour, and the truck and pump don't wait for free. Each pour has three places where the estimate and the real job drift apart. Track all three on every pour, and you'll know where your margin went.
Where concrete jobs leak money
- Yards. What you estimated, what you ordered, and what actually went in the forms aren't the same number.
- Pump and truck time. Setup, hours on site, and waiting all show up on the bill.
- Finishing hours. Weather, a late truck, or a tricky finish can add hours you didn't price.
If you only look at the total at the end of the job, those three blend together. Split them, and each one tells you something you can fix on the next bid.
Yards: estimated, ordered, placed, returned
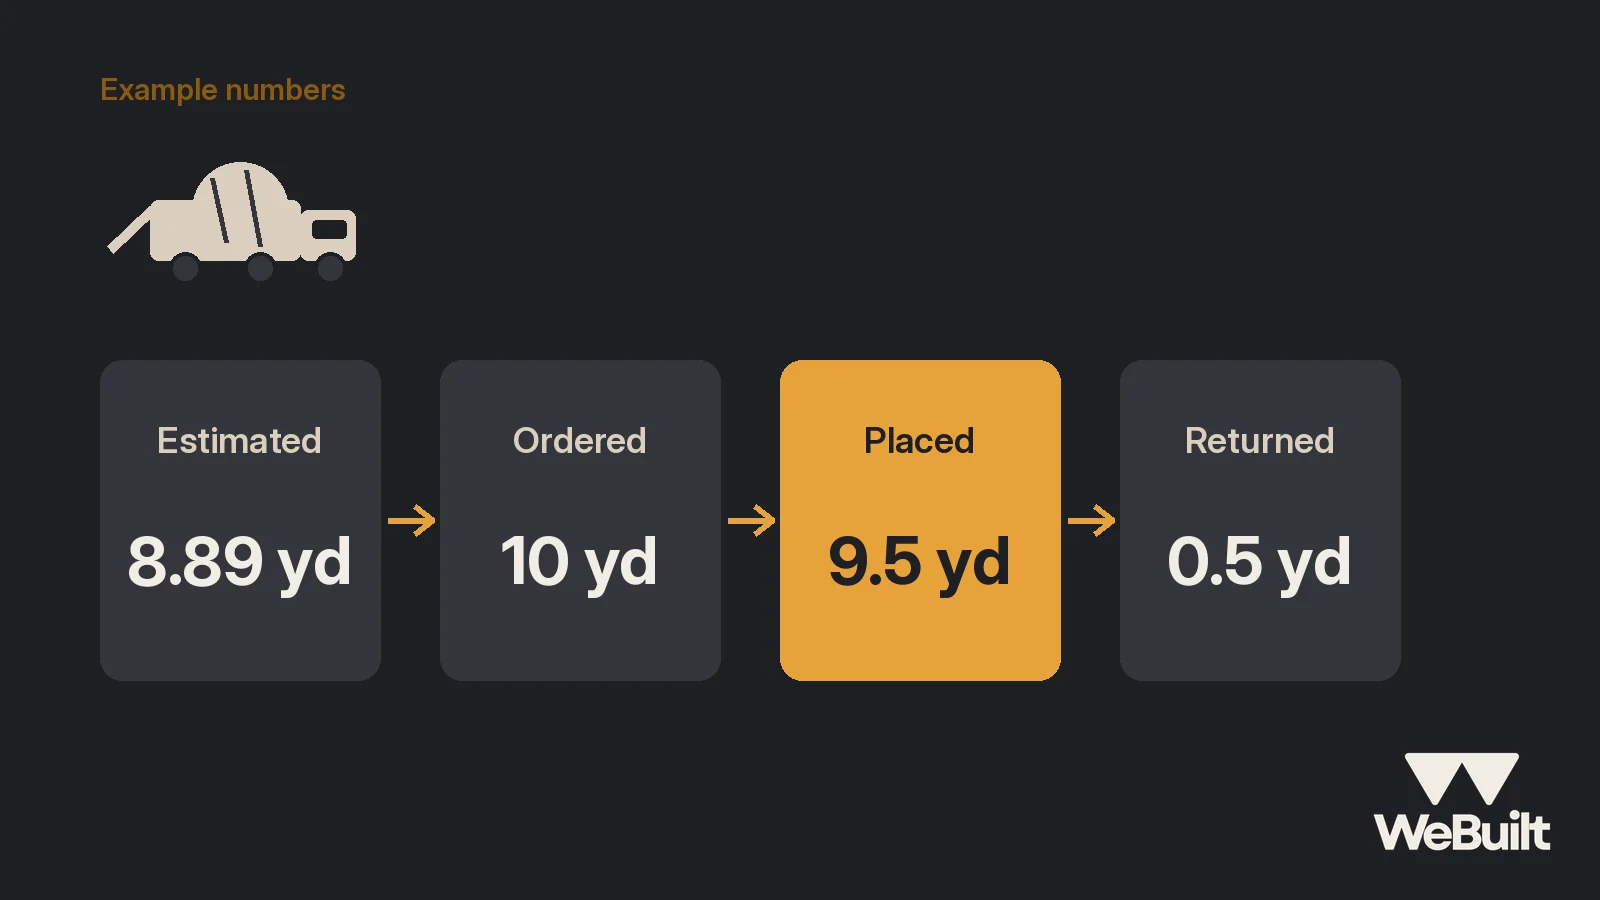
ACI says it plainly: "Concrete is sold by volume—in cubic yards or cubic meters—while in a freshly mixed unhardened state and as discharged from the truck mixer" [1]. So every pour has four volume numbers worth writing down:
- Estimated: length × width × thickness in feet, then divide by 27 to get cubic yards [1].
- Ordered: the estimate plus overage, rounded up.
- Placed: what went in the forms.
- Returned: what went back on the truck.
ACI's own worked example is a commercial-scale strip placement, 200 ft by 50 ft at 5 inches. It works out to 4,200 cubic feet, and 4,200 ÷ 27 = 155.6 cubic yards [1]. Adding 5% (7.8 cubic yards) gives 163.4, and the order is "rounded up to the nearest yd3," or 164 cubic yards [1].
How much extra to order is its own topic. ACI notes that it's "common to add 10% or 15% to small loads and 5% to 10% to larger orders" for subgrade settlement, uneven subgrade, spillage, and waste [1]. We covered ordering in our waste factors guide. This post is about what happens after: comparing what you ordered and placed to what you estimated. The delivery ticket is your record. Keep it with the job.
Price per yard keeps moving
Your estimate's price per yard is only as good as the day you got the quote. The BLS producer price index for ready-mix concrete was 395.319 in September 2026 (preliminary) and 386.267 in September 2025 [2]. By our calculation from that preliminary data, that's up about 2.3% year over year [2].
That's an index, not a price per yard, so don't use it to price a job. Use it as a reminder: get a current quote from your supplier before you send the estimate, and put a good-through date on yours. Then check estimate vs. actual weekly while the job runs.
Pump and truck time
We're not going to quote pump rates. They vary by supplier, pump size, and job, and we didn't confirm any Utah figures. Pull these lines from your own supplier's quote and track each one:
- Pump setup or mobilization
- Hourly or per-yard pump charges
- Minimum charges
- Standby or waiting time
- Any short-load charges your supplier uses
Then record the actual times on the pour: truck arrival, start of discharge, and departure, plus pump start and stop. Waiting time is the one that hides. If the second truck is 40 minutes late, your crew and the pump are both on the clock.
Finishers: hours by task
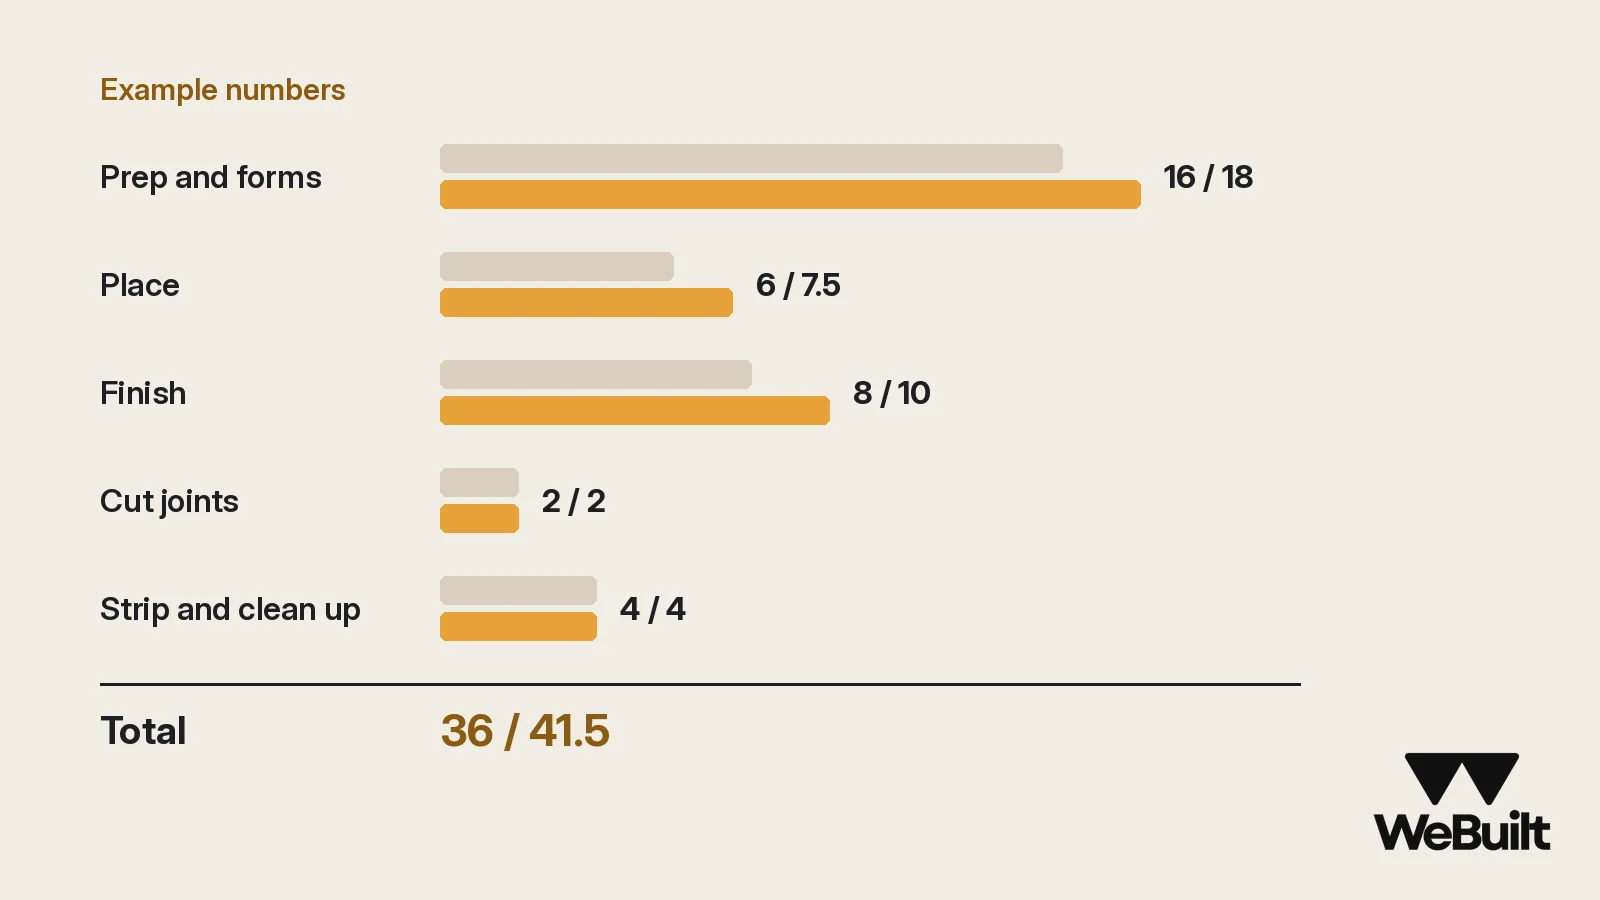
Labor is where concrete margins usually move the most. For scale, the May 2025 BLS median wage for cement masons and concrete finishers in Utah was $27.13 an hour, close to the U.S. median of $27.41 [3][4]. That's the wage only. Your loaded rate, with payroll taxes, workers' comp, and benefits, is higher, and it's the number to price and track with. Our labor burden guide walks through it.
Track crew hours by task, not just per day:
- Prep and forms
- Place
- Finish
- Cut joints
- Strip forms and clean up
Example: one driveway, estimate vs. actual
Example numbers for illustration, made up for this post. A residential driveway, 24 ft by 30 ft at 4 inches thick.
Yards: 24 × 30 × (4 ÷ 12) = 240 cubic feet. 240 ÷ 27 = 8.89 cubic yards estimated. With 10% overage, that's 9.78, so the order is rounded up to 10 cubic yards. The tickets show 9.5 cubic yards placed and 0.5 returned.
Pump time: estimated at 2.0 hours. Actual was 3.25 hours, including 45 minutes waiting on the second load.
Crew hours:
| Task | Estimated hours | Actual hours |
|---|---|---|
| Prep and forms | 16 | 18 |
| Place | 6 | 7.5 |
| Finish | 8 | 10 |
| Cut joints | 2 | 2 |
| Strip and clean up | 4 | 4 |
| Total | 36 | 41.5 |
What this job says: yards were fine (the subgrade took a bit more than the estimate, which is what the overage is for). The real misses were the 45 minutes of waiting and 5.5 extra crew hours, mostly in place and finish, while the crew waited on the truck and then chased the slab. Multiply those hours by your loaded rate and you know what the late truck cost. The fix might be a scheduling talk with the supplier, or a standby line in your next estimate.
A one-page pour log
Fill this in on every pour, the same day:
- Date, job, and pour location
- Yards estimated, ordered, placed, and returned (from the ticket)
- Truck arrival and departure times
- Pump start and stop times, and any standby
- Crew hours by task
- Weather and anything unusual
It takes five minutes. A week later, nobody remembers when the second truck showed up.
How WeBuilt helps
WeBuilt keeps the pour's numbers with the job. You record the costs that come off the pour log against that job: concrete from the ticket, pump charges, and crew labor. WeBuilt shows revenue, cost, and margin for the job, so you can compare it to what you estimated and see profit per job instead of a guess at the end of the season. It doesn't read delivery tickets or connect to your ready-mix supplier. You enter what happened. Over a season, you'll see which kinds of pours hold their margin and which ones keep slipping. See what's included today.
FAQ
How do you calculate cubic yards of concrete?
Multiply length × width × thickness in feet to get cubic feet, then divide by 27 [1]. ACI's example: 4,200 ÷ 27 = 155.6 cubic yards [1].
How much has ready-mix concrete gone up?
The BLS ready-mix price index was up about 2.3% from September 2025 to September 2026, by our calculation from preliminary data [2]. It's an index, not a price per yard.
What should a concrete contractor track on every job?
Yards estimated, ordered, placed, and returned; pump and truck time, including waiting; and crew hours by task. Compare each to the estimate.
Join the Founding 25
Founding 25 spots are open for Utah concrete contractors who want profit per job on every pour. See the platform and the Founding 25 offer.
Sources
- American Concrete Institute, CCS-1 Concrete Craftsman Series: Slabs-on-Ground (preview). Accessed November 2, 2026.
- U.S. Bureau of Labor Statistics, Producer Price Index, Ready-mix concrete (WPU1333). Accessed November 2, 2026.
- U.S. Bureau of Labor Statistics, OEWS May 2025, Cement Masons and Concrete Finishers (47-2051), Utah hourly median wage (series OEUS490000000000047205108). Accessed November 2, 2026.
- U.S. Bureau of Labor Statistics, OEWS May 2025, Cement Masons and Concrete Finishers (47-2051), U.S. hourly median wage (series OEUN000000000000047205108). Accessed November 2, 2026.